In this post, we try to apply different classification models on a real data. In addition, we provide tables and diagrams for optimized hyperparameters.
In machine learning, hyperparameter optimization or tuning is the problem of choosing a set of optimal hyperparameters for a learning algorithm. A hyperparameter is a parameter whose value is used to control the learning process. By contrast, the values of other parameters (typically node weights) are learned.
First we import required and utilized model libraries:
# Importing


import pandas as pd
import numpy as np
import seaborn as sns
import matplotlib.pyplot as plt
from xgboost import XGBClassifier
from sklearn.svm import SVC
from sklearn.metrics import confusion_matrix, ConfusionMatrixDisplay, classification_report, confusion_matrix, accuracy_score
from sklearn.model_selection import GridSearchCV, train_test_split
from sklearn.neighbors import KNeighborsClassifier
from sklearn.ensemble import RandomForestClassifier
from sklearn.tree import DecisionTreeClassifier
from sklearn.feature_selection import RFECV
Loading data and having and general view on them:
# loading data

data = pd.read_csv('fetal_health.csv')
Histogram diagram of a few of data:
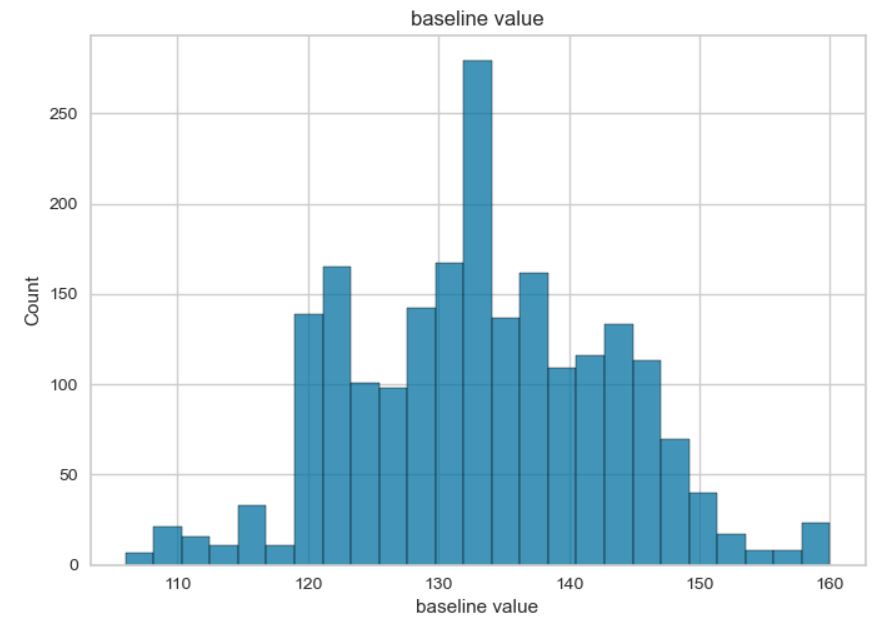
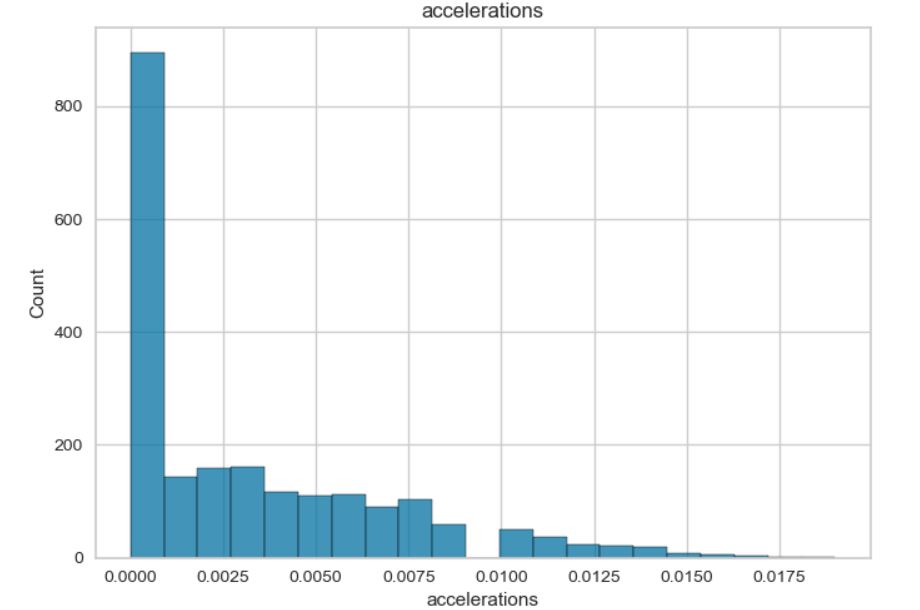
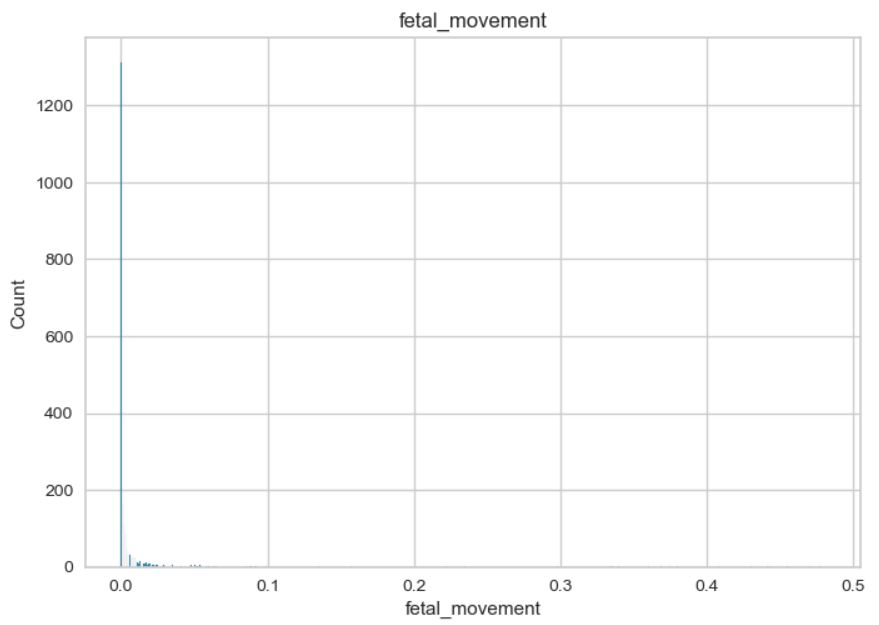
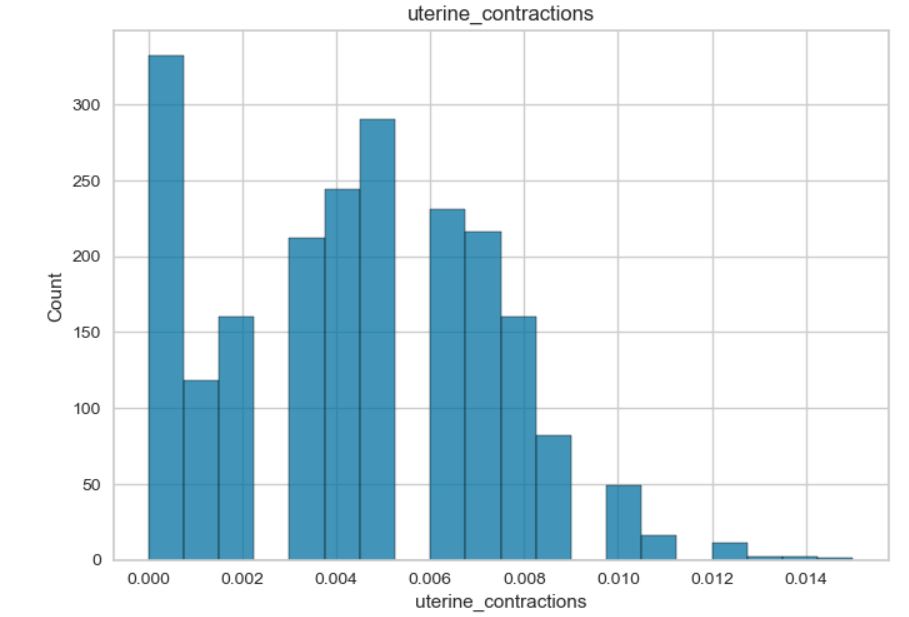
Review on data: Some of the data exhibit a normal distribution, while others show a skewed distribution. The “fetal_health” and “histogram_tendency” columns contain categorical variables. The data is imbalanced, with the majority of fetal assessments being positive. Additionally, there are significant variations in the minimum and maximum values of the features.
Examining the relationship among different features:
# checking connection between different features

corr_data = data.copy()
correlation_matrix = corr_data.corr()

plt.figure(figsize=(16,12))
sns.heatmap(correlation_matrix, annot=True,fmt=".2f", cmap="Greens")
plt.show()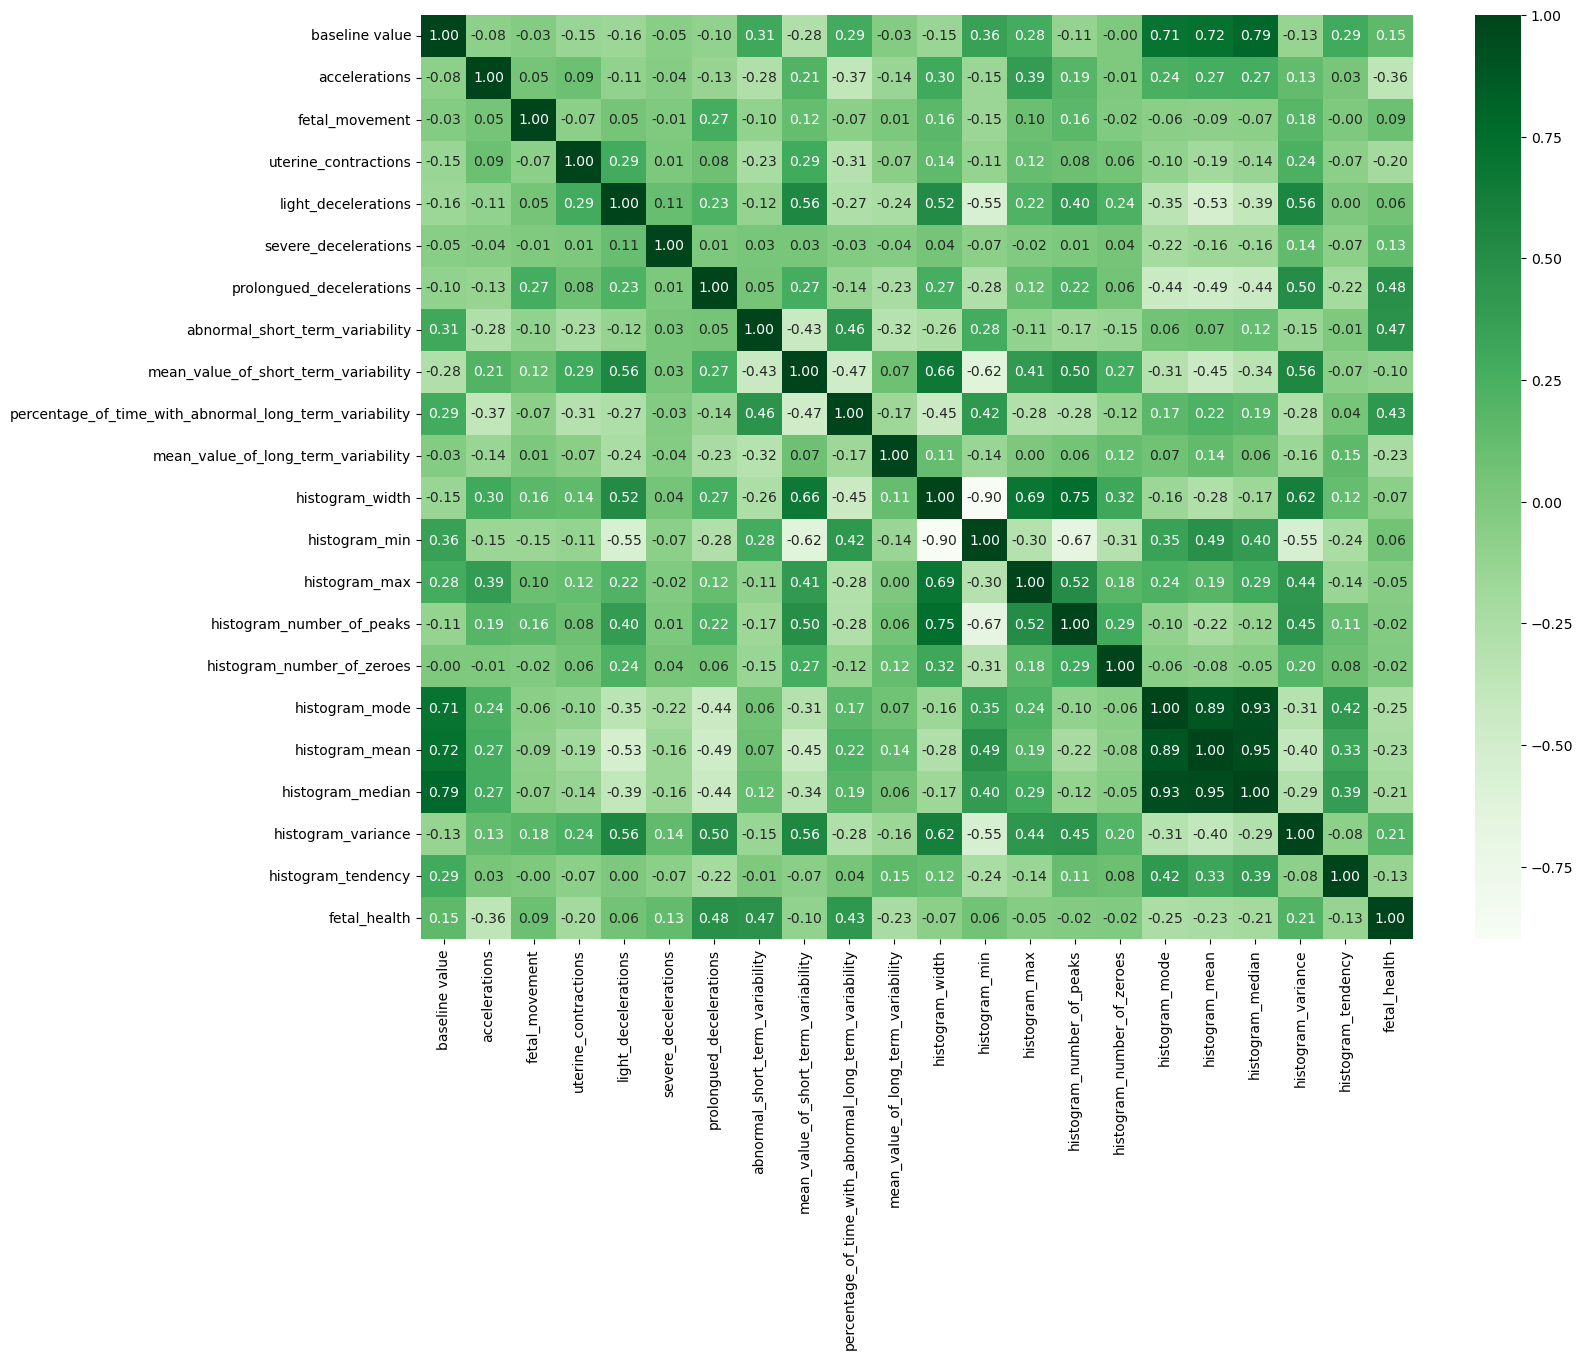
Certain features exhibit strong positive and negative correlations, necessitating the need for feature selection.
Train and Test Split with test size of 20%:
# test and train split

y = data[['fetal_health']]
features = data.drop(['fetal_health'], axis=1)
x = (features - features.mean()) / (features.std()) #standardized features


x_train, x_test, y_train, y_test = train_test_split(x, y, test_size = 0.2, random_state = 0)
Recursive Feature Elimination: Recursive Feature Elimination (RFE) is a technique for feature selection wherein a model is fitted, and the least impactful feature (or features) is iteratively removed until the desired number of features is attained. The ranking of features is determined by the model’s coef_ or feature_importances_ attributes. By systematically eliminating a small number of features in each iteration, RFE aims to mitigate dependencies and collinearity (a situation where two or more predictor variables are closely related to one another) within the model.
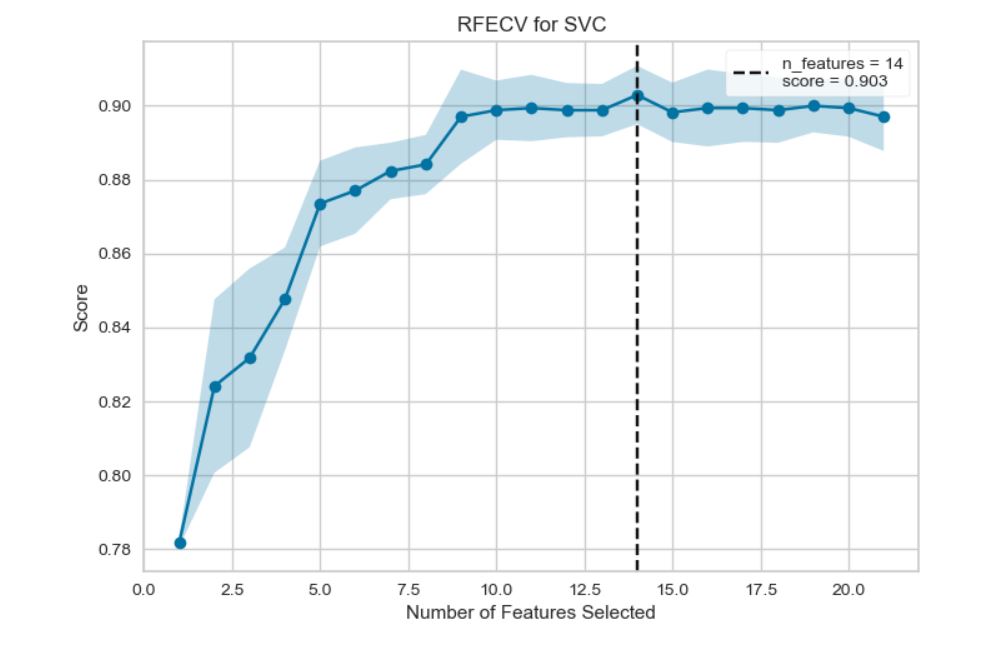
While RFE necessitates a predetermined number of features to retain, determining the optimal number of features beforehand is often challenging. Cross-validation is employed in conjunction with RFE to evaluate various feature subsets, allowing the selection of the most favorable set based on scores. The RFECV visualizer illustrates the relationship between the number of features in the model, their cross-validated test scores, and variability, ultimately highlighting the optimal number of features chosen.
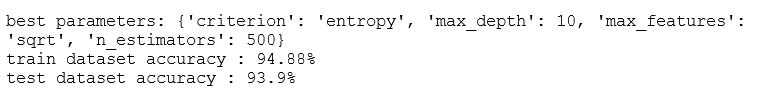
Random Forest Classification tuning with Grid_search:
A model hyperparameter is an attribute of a model that exists external to the model itself, and its value cannot be deduced from the available data. This value must be predetermined before the commencement of the learning process. Examples include ‘c’ in Support Vector Machines, ‘k’ in k Nearest Neighbors, and the number of hidden layers in Neural Networks.
In contrast, a parameter is an inherent characteristic of the model, and its value can be derived from the data. Examples encompass beta coefficients in linear/logistic regression or support vectors in Support Vector Machines.
- Grid-search is a technique employed to identify the optimal hyperparameters for a model, aiming to produce the most accurate predictions.
Applying model and found the fitting model with optimized hyperparameters and calculating accuracy:
# Create a table with the results of the classifiers

scoreTable = pd.DataFrame()

def add_to_scoreTable(model, accuracy_train, accuracy_test, best_params, scoreTable):

    result = pd.DataFrame(pd.concat([pd.Series({'accuracy_test': accuracy_test, 'accuracy_train': accuracy_train}), pd.Series(best_params)], axis = 0), columns = [model])

    return pd.concat([scoreTable, result], axis = 1)


classifier = RandomForestClassifier()
rfecv = RFECV(estimator=classifier, step=1, cv=5, scoring='accuracy')   #5-fold cross-validation
rfecv = rfecv.fit(x_train, y_train.values.ravel())

print('Optimal number of features :', rfecv.n_features_)
print('Best features :', x_train.columns[rfecv.support_])

best_features = x_train.columns[rfecv.support_]

# application of new features to x_train, and y_test

x_train = x_train[best_features]
x_test = x_test[best_features]

param_grid = {
    'n_estimators': [100, 200, 500],
    'max_features': [ 'sqrt', 'log2'],
    'max_depth' : [8, 10],
    'criterion' :['gini', 'entropy']
    }

# Optimized hyperparameters for Random Forest Classification:

grid = GridSearchCV(RandomForestClassifier(random_state=0), param_grid, refit = True, verbose = 3)
grid.fit(x_train, y_train.values.ravel())

# prediction with opitimized hyperparameters and calculating accuracy

print('best parameters: {}\n'.format(grid.best_params_))

y_pred = grid.best_estimator_.predict(x_test)

accuracy_train = (grid.best_score_ * 100).round(2)
accuracy_test = (accuracy_score(y_test, y_pred) * 100).round(2)

print("train dataset accuracy : {}%".format(accuracy_train))
print("test dataset accuracy : {}%".format(accuracy_test))
Outputs:

Confusion Matrix for Random Forest:
# Confusion Matrix

ConfusionMatrixDisplay.from_estimator(grid.best_estimator_, x_test, y_test)
scoreTable = add_to_scoreTable('RandomForestClassifier', accuracy_train, accuracy_test, grid.best_params_, scoreTable)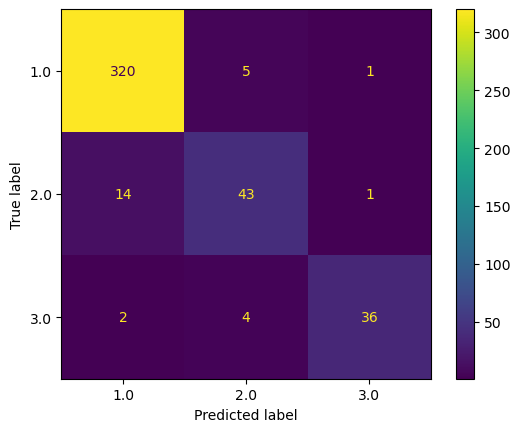
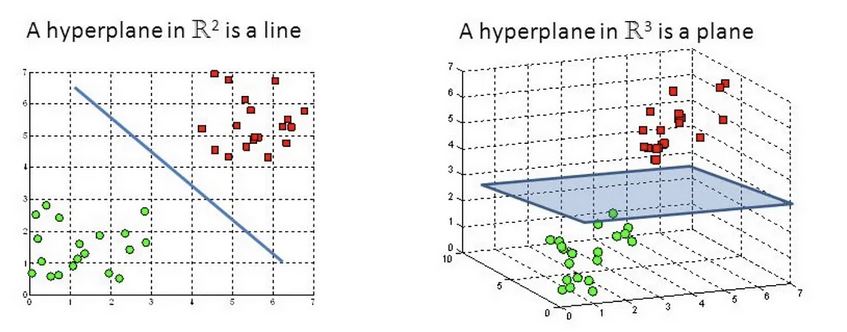
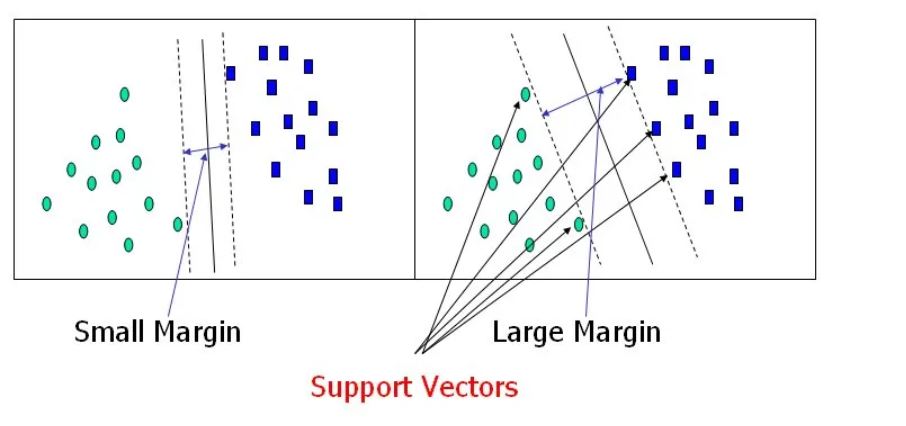
Support Vector Machine Classification: The goal of the support vector machine algorithm is to identify a hyperplane in an N-dimensional space (where N represents the number of features) that effectively separates and classifies the data points.
Numerous hyperplanes can be considered to separate the two classes of data points. Our aim is to identify a plane with the maximum margin, signifying the greatest distance between data points of both classes. Maximizing this margin distance enhances the robustness of the classification, allowing for increased confidence in classifying future data points.
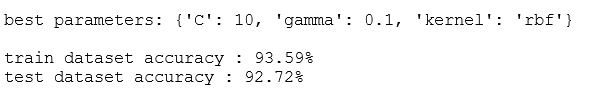
Optimized hyperparameters for SVC model and calculating accuracy with optimized features:
# Finding optimized Hyperparameters for SVC model


param_grid = {
    'C': [0.1, 1, 10, 100, 1000],
    'gamma': [1, 0.1, 0.01, 0.001, 0.0001],
    'kernel': ['rbf'] #also tried: 'linear', 'poly', 'sigmoid'
    }

grid = GridSearchCV(SVC(random_state=0), param_grid, refit = True, verbose = 3)
grid.fit(x_train, y_train.values.ravel())

# Accuracy for SVC model
print('best parameters: {}\n'.format(grid.best_params_))

y_pred = grid.best_estimator_.predict(x_test)

accuracy_train = (grid.best_score_ * 100).round(2)
accuracy_test = (accuracy_score(y_test, y_pred) * 100).round(2)

print("train dataset accuracy : {}%".format(accuracy_train))
print("test dataset accuracy : {}%".format(accuracy_test))
Outputs:

Confusion Matrix for SVC model:
# Confusion Matrix of SVC model
ConfusionMatrixDisplay.from_estimator(grid.best_estimator_, x_test, y_test)
scoreTable = add_to_scoreTable('SVC', accuracy_train, accuracy_test, grid.best_params_, scoreTable)
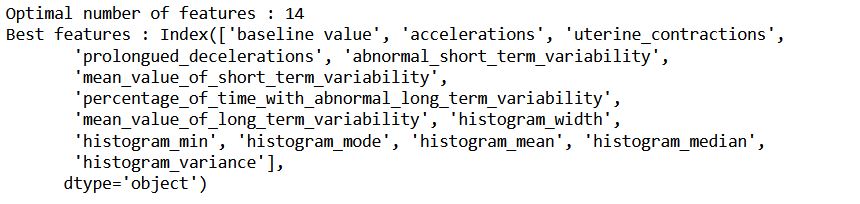
Optimized number of features for SVC model:
KNN model: The k-nearest neighbors algorithm, commonly referred to as KNN or k-NN, is a non-parametric, supervised learning classifier. It leverages proximity to classify or predict the grouping of an individual data point. Although applicable to both regression and classification problems, it is predominantly employed as a classification algorithm. The underlying assumption is that similar points tend to be located in close proximity to each other.
Implement KNN model, find optimized n_neighbor and calculating accuracy with optimized parameters:
# KNN model
accuracy = np.zeros(100)
for i in range(1,101):
knn = KNeighborsClassifier(n_neighbors = i).fit(x_train, y_train.values.ravel())
yhat= knn.predict(x_test)
accuracy[i-1] = accuracy_score(y_test, yhat)
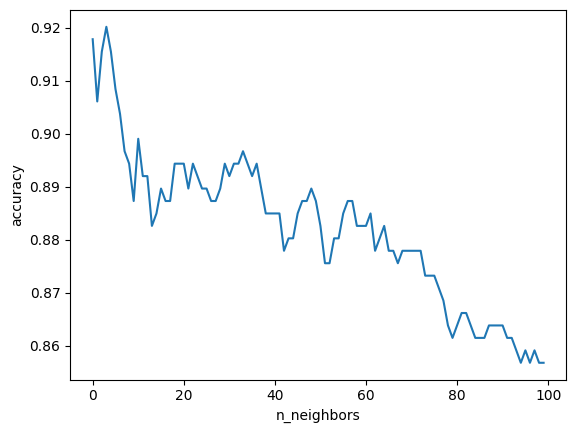
# Optimized N for KNN
ax = sns.lineplot(accuracy)
ax.set(xlabel = 'n_neighbors', ylabel = 'accuracy')
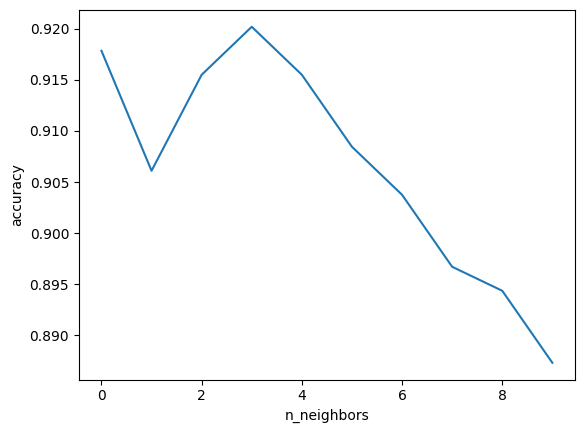
ax = sns.lineplot(accuracy[:10])
ax.set(xlabel = 'n_neighbors', ylabel = 'accuracy')
param_grid = {
'n_neighbors' : [i for i in range(1,9)],
'weights' : ['uniform','distance'],
'metric' : ['minkowski','euclidean','manhattan']
}
grid = GridSearchCV(KNeighborsClassifier(), param_grid, refit = True, verbose = 3)
grid.fit(x_train, y_train.values.ravel())
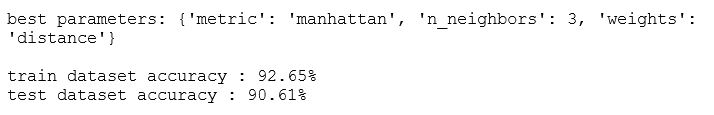
print('best parameters: {}\n'.format(grid.best_params_))
y_pred = grid.best_estimator_.predict(x_test)
# Accuracy for KNN
accuracy_train = (grid.best_score_ * 100).round(2)
accuracy_test = (accuracy_score(y_test, y_pred) * 100).round(2)
print("train dataset accuracy : {}%".format(accuracy_train))
print("test dataset accuracy : {}%".format(accuracy_test))Outputs:
Confusion Matrix for KNN:
# Confusion Matrix for KNN

ConfusionMatrixDisplay.from_estimator(grid.best_estimator_, x_test, y_test)
scoreTable = add_to_scoreTable('KNeighborsClassifier', accuracy_train, accuracy_test, grid.best_params_, scoreTable)
Decision Tree Classification model:
# Decision Tree

param_grid = {
    'max_features': [ 'sqrt', 'log2'],
    'max_depth' : [4,5,6,7,8],
    'criterion' :['gini', 'entropy']
    }

grid = GridSearchCV(DecisionTreeClassifier(random_state=0), param_grid, refit = True, verbose = 3)
grid.fit(x_train, y_train.values.ravel())
Optimized hyperparameters and calculating accuracy:
# Optimized Hyperparameters and calculating accuracy

print('best parameters: {}\n'.format(grid.best_params_))

y_pred = grid.best_estimator_.predict(x_test)

accuracy_train = (grid.best_score_ * 100).round(2)
accuracy_test = (accuracy_score(y_test, y_pred) * 100).round(2)

print("train dataset accuracy : {}%".format(accuracy_train))
print("test dataset accuracy : {}%".format(accuracy_test))
Outputs:

Confusion Matrix for Decision Tree:
# Cofusion Matrix for Decision Tree
ConfusionMatrixDisplay.from_estimator(grid.best_estimator_, x_test, y_test)
scoreTable = add_to_scoreTable('DecisionTreeClassifier', accuracy_train, accuracy_test, grid.best_params_, scoreTable)
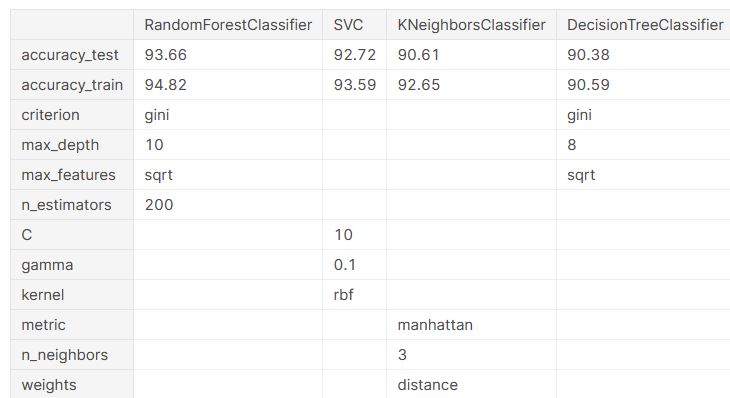
Result table for comparison:
All codes:
# Importing


import pandas as pd
import numpy as np
import seaborn as sns
import matplotlib.pyplot as plt
from xgboost import XGBClassifier
from sklearn.svm import SVC
from sklearn.metrics import confusion_matrix, ConfusionMatrixDisplay, classification_report, confusion_matrix, accuracy_score
from sklearn.model_selection import GridSearchCV, train_test_split
from sklearn.neighbors import KNeighborsClassifier
from sklearn.ensemble import RandomForestClassifier
from sklearn.tree import DecisionTreeClassifier
from sklearn.feature_selection import RFECV


# loading data

data = pd.read_csv('fetal_health.csv')

# checking connection between different features

corr_data = data.copy()
correlation_matrix = corr_data.corr()

plt.figure(figsize=(16,12))
sns.heatmap(correlation_matrix, annot=True,fmt=".2f", cmap="Greens")
plt.show()


# test and train split

y = data[['fetal_health']]
features = data.drop(['fetal_health'], axis=1)
x = (features - features.mean()) / (features.std()) #standardized features


x_train, x_test, y_train, y_test = train_test_split(x, y, test_size = 0.2, random_state = 0)

# Create a table with the results of the classifiers

scoreTable = pd.DataFrame()

def add_to_scoreTable(model, accuracy_train, accuracy_test, best_params, scoreTable):

    result = pd.DataFrame(pd.concat([pd.Series({'accuracy_test': accuracy_test, 'accuracy_train': accuracy_train}), pd.Series(best_params)], axis = 0), columns = [model])

    return pd.concat([scoreTable, result], axis = 1)


classifier = RandomForestClassifier()
rfecv = RFECV(estimator=classifier, step=1, cv=5, scoring='accuracy')   #5-fold cross-validation
rfecv = rfecv.fit(x_train, y_train.values.ravel())

print('Optimal number of features :', rfecv.n_features_)
print('Best features :', x_train.columns[rfecv.support_])

best_features = x_train.columns[rfecv.support_]

# application of new features to x_train, and y_test

x_train = x_train[best_features]
x_test = x_test[best_features]

param_grid = {
    'n_estimators': [100, 200, 500],
    'max_features': [ 'sqrt', 'log2'],
    'max_depth' : [8, 10],
    'criterion' :['gini', 'entropy']
    }

# Optimized hyperparameters for Random Forest Classification:

grid = GridSearchCV(RandomForestClassifier(random_state=0), param_grid, refit = True, verbose = 3)
grid.fit(x_train, y_train.values.ravel())

# prediction with opitimized hyperparameters and calculating accuracy

print('best parameters: {}\n'.format(grid.best_params_))

y_pred = grid.best_estimator_.predict(x_test)

accuracy_train = (grid.best_score_ * 100).round(2)
accuracy_test = (accuracy_score(y_test, y_pred) * 100).round(2)

print("train dataset accuracy : {}%".format(accuracy_train))
print("test dataset accuracy : {}%".format(accuracy_test))

# Confusion Matrix

ConfusionMatrixDisplay.from_estimator(grid.best_estimator_, x_test, y_test)
scoreTable = add_to_scoreTable('RandomForestClassifier', accuracy_train, accuracy_test, grid.best_params_, scoreTable)

# Finding optimized Hyperparameters for SVC model


param_grid = {
    'C': [0.1, 1, 10, 100, 1000],
    'gamma': [1, 0.1, 0.01, 0.001, 0.0001],
    'kernel': ['rbf'] #also tried: 'linear', 'poly', 'sigmoid'
    }

grid = GridSearchCV(SVC(random_state=0), param_grid, refit = True, verbose = 3)
grid.fit(x_train, y_train.values.ravel())

# Accuracy for SVC model
print('best parameters: {}\n'.format(grid.best_params_))

y_pred = grid.best_estimator_.predict(x_test)

accuracy_train = (grid.best_score_ * 100).round(2)
accuracy_test = (accuracy_score(y_test, y_pred) * 100).round(2)

print("train dataset accuracy : {}%".format(accuracy_train))
print("test dataset accuracy : {}%".format(accuracy_test))

# Confusion Matrix of SVC model
ConfusionMatrixDisplay.from_estimator(grid.best_estimator_, x_test, y_test)
scoreTable = add_to_scoreTable('SVC', accuracy_train, accuracy_test, grid.best_params_, scoreTable)

# KNN model
accuracy = np.zeros(100)
for i in range(1,101):
    knn = KNeighborsClassifier(n_neighbors = i).fit(x_train, y_train.values.ravel())
    yhat= knn.predict(x_test)
    accuracy[i-1] = accuracy_score(y_test, yhat)


# Optimized N for KNN

ax = sns.lineplot(accuracy)
ax.set(xlabel = 'n_neighbors', ylabel = 'accuracy')


ax = sns.lineplot(accuracy[:10])
ax.set(xlabel = 'n_neighbors', ylabel = 'accuracy')

param_grid = {
    'n_neighbors' : [i for i in range(1,9)],
    'weights' : ['uniform','distance'],
    'metric' : ['minkowski','euclidean','manhattan']
    }

grid = GridSearchCV(KNeighborsClassifier(), param_grid, refit = True, verbose = 3)
grid.fit(x_train, y_train.values.ravel())

print('best parameters: {}\n'.format(grid.best_params_))

y_pred = grid.best_estimator_.predict(x_test)

# Accuracy for KNN

accuracy_train = (grid.best_score_ * 100).round(2)
accuracy_test = (accuracy_score(y_test, y_pred) * 100).round(2)

print("train dataset accuracy : {}%".format(accuracy_train))
print("test dataset accuracy : {}%".format(accuracy_test))

# Confusion Matrix for KNN

ConfusionMatrixDisplay.from_estimator(grid.best_estimator_, x_test, y_test)
scoreTable = add_to_scoreTable('KNeighborsClassifier', accuracy_train, accuracy_test, grid.best_params_, scoreTable)

# Decision Tree

param_grid = {
    'max_features': [ 'sqrt', 'log2'],
    'max_depth' : [4,5,6,7,8],
    'criterion' :['gini', 'entropy']
    }

grid = GridSearchCV(DecisionTreeClassifier(random_state=0), param_grid, refit = True, verbose = 3)
grid.fit(x_train, y_train.values.ravel())

# Optimized Hyperparameters and calculating accuracy

print('best parameters: {}\n'.format(grid.best_params_))

y_pred = grid.best_estimator_.predict(x_test)

accuracy_train = (grid.best_score_ * 100).round(2)
accuracy_test = (accuracy_score(y_test, y_pred) * 100).round(2)

print("train dataset accuracy : {}%".format(accuracy_train))
print("test dataset accuracy : {}%".format(accuracy_test))

# Cofusion Matrix for Decision Tree
ConfusionMatrixDisplay.from_estimator(grid.best_estimator_, x_test, y_test)
scoreTable = add_to_scoreTable('DecisionTreeClassifier', accuracy_train, accuracy_test, grid.best_params_, scoreTable)